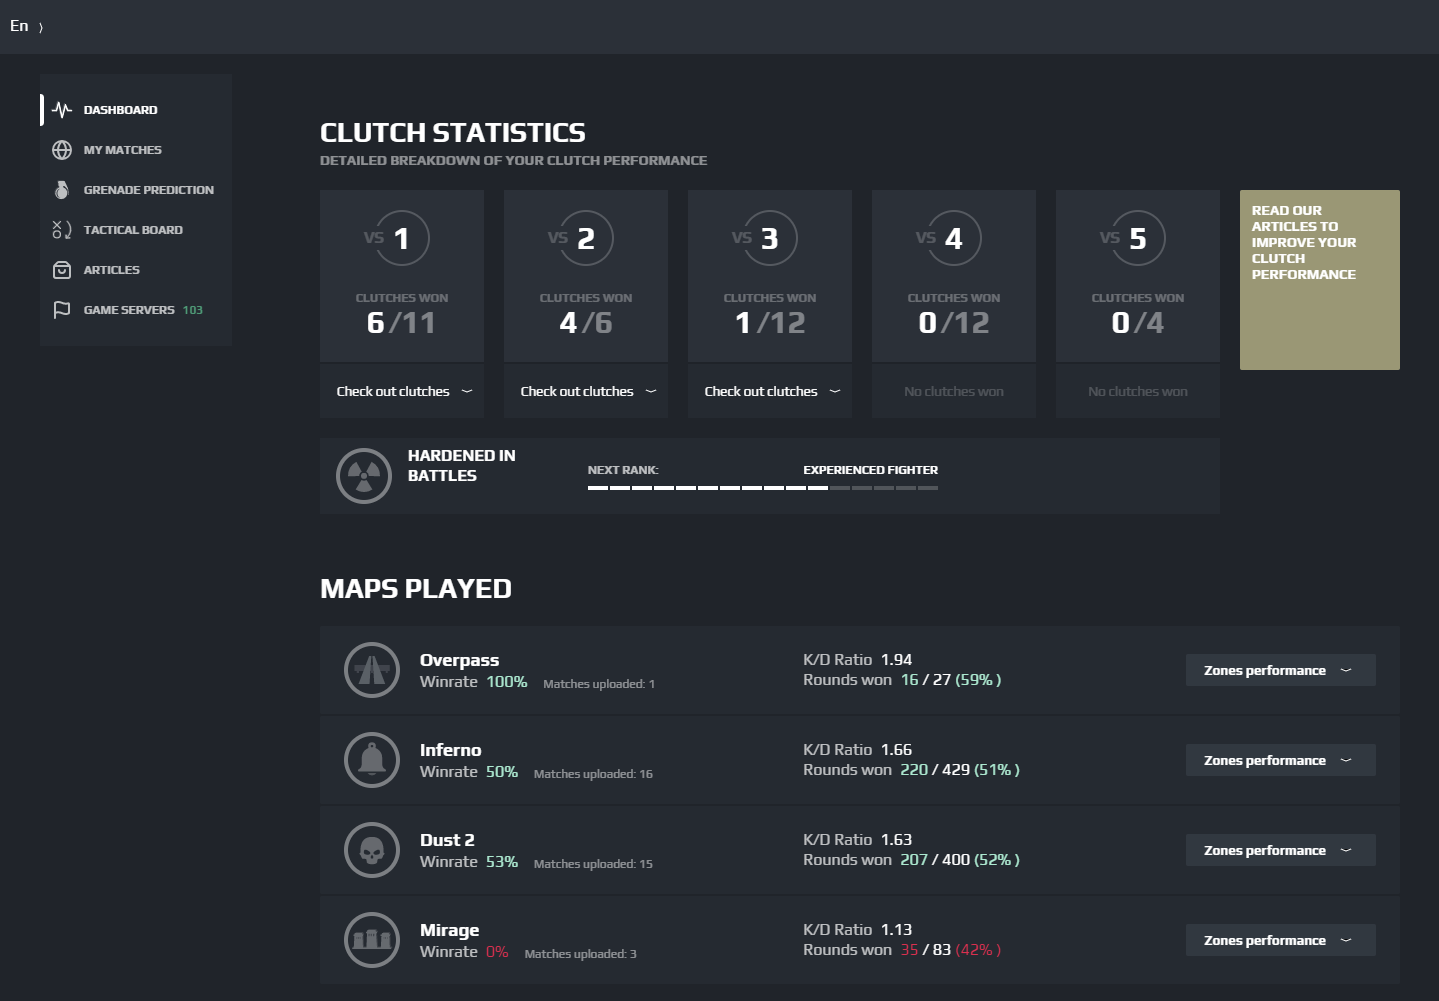
You can find "Map Performance" section below Dashboard and Clutch Statistics on the Dashboard page.
By default you will have an open map with the highest winrate.
In the collapsed state you could following stats on each map:
• Winrate
• The Number of uploaded matches
• K/D ratio
• Rounds won (absolute numbers and percentage).
Detailed overview
If you click on "Zones performance" button you will see the heatmap and a couple of filters.
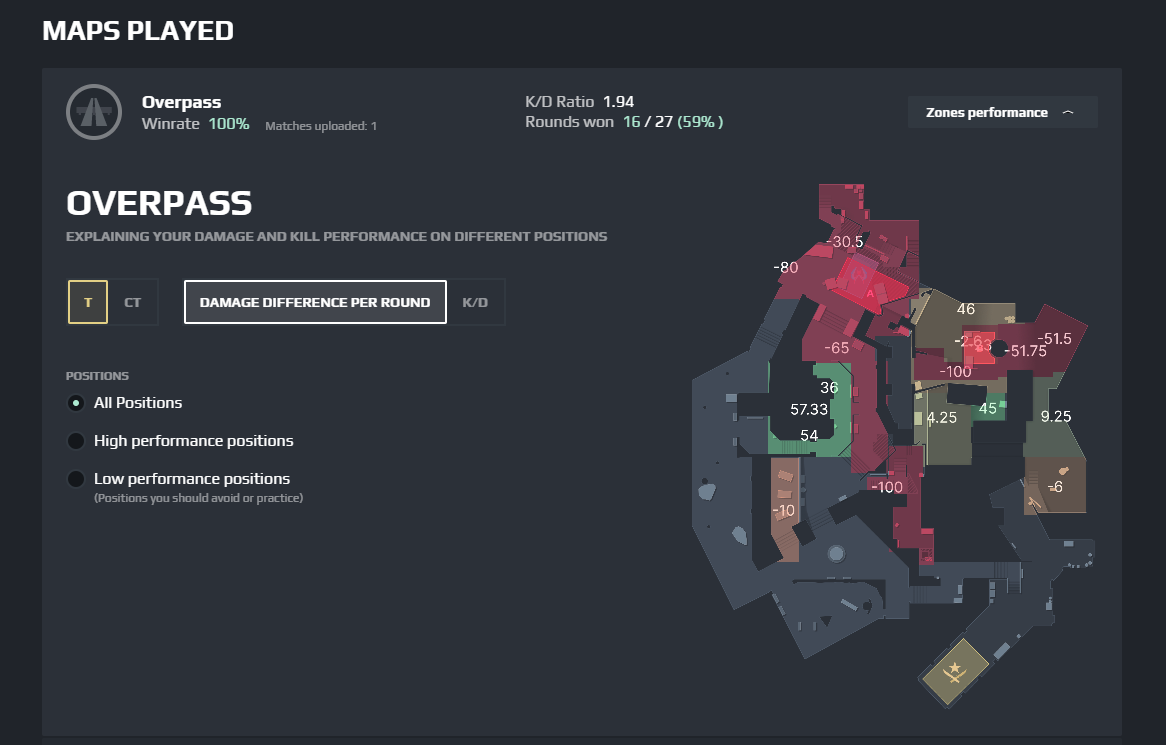
Red zones is your worst positions on the map, green zones are the best. Shades of red and green show the appropriate level of performance.
Sign up at SCOPE.GG to improve your skill faster and qualitative!
You can choose between high and low performance positions to take a look at the most successful and unsuccessful positions on the map.
What are those numbers on images? It's numerical value of Average Damage Difference (we count it as the difference between ADR and Damage Received).
If you want, just switch to K/D ratio.
The most important part is that you could choose between T and CT sides! It allows you to get a clear understanding of your performance.
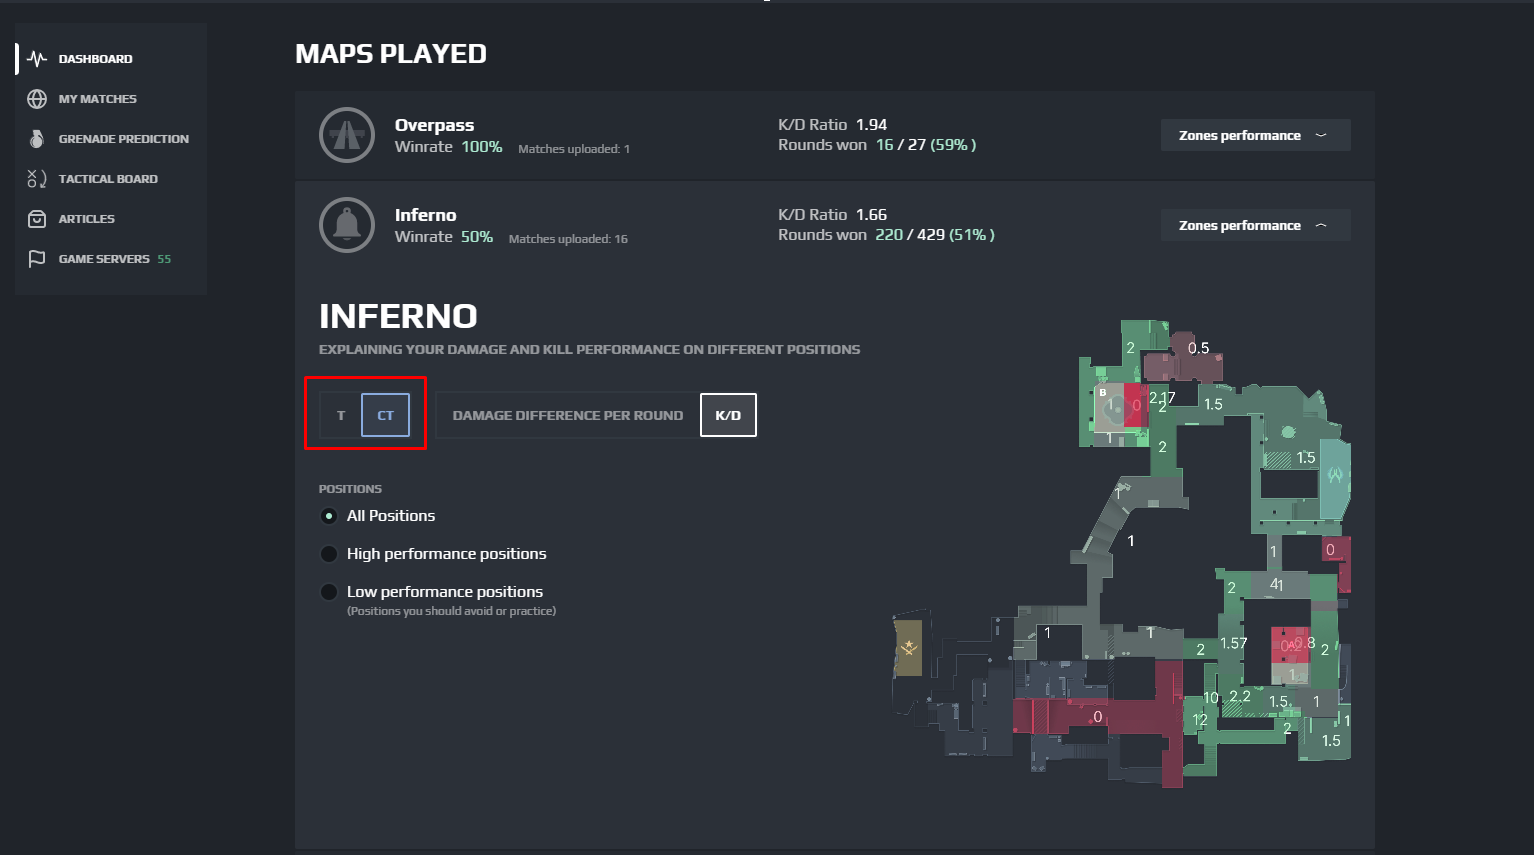
It's easy to use feature.
Avoid or practice red zones to improve the performance there. It could be very useful to take a look at 2D-replay of the recent matches on the particular map and think about what you could do better or differently.
Green zones show your most effective positions on the map. Probably, you feel сomfortable and confident playing there. Keep playing those zones to bring more impact.
Good luck & have fun!
Read more: Everything you need to know about molotov in one article